Sampark Madhya Pradesh
Demography of Bhils
Madhya Pradesh’s Scheduled Tribe (ST) population is 12,233,474 as per 2001 census. This constitutes 20.3 per cent of the total population (60,348,023) of the State. Madhya Pradesh holds first rank among all the States/UTs in terms of ST population and 12th rank in respect of the proportion of ST population to total population. The growth of the ST population during 1991-2001 has been 26.4 per cent, which is 2.1 per cent higher than the overall growth of total population (24.3 per cent). The State has a total of 46 Scheduled Tribes.
The Scheduled Tribe population in the State is overwhelmingly rural, with 93.6 per cent residing in rural areas. At district level, STs have returned the highest proportion in Jhabua district (86.8 per cent) followed by Barwani (67 per cent), Dindori (64.5 per cent) and Mandla (57.2 per cent) districts. Bhind district preceded by Morena and Datia has the lowest proportion of STs (0.5 per cent).
Population -Size and Distribution
Out of 46 STs, Bhil is the most populous tribe having a number of 4,618,068, constituting 37.7 per cent of the total ST population. Gond is the second largest tribe, with a population of 4,357,918 constituting 35.6 per cent. Four other STs in the descending order are Kol, Korku, Sahariya and Baiga. Along with Bhil and Gond, the six tribes constitute 92.2 per cent of the total ST population of the State. Pardhan, Saur and Bharia Bhumia have a population ranging from 105,692 to 152,472; together, they form 3.2 per cent. Four tribes, namely, Majhi, Khairwar, Mawasi and Panika having population in the range of 47,806 to 81,335 account for another 2.2 per cent of the ST population; remaining 33 tribes along with the generic tribes constitute the residual 2.5 per cent of total ST population. Tribes having below 1,000 population are 12 in number. Of them, five tribes, namely, Mina, Andh, Birhul, Parja and Nagesia each have less than 500 population.
Bhils have the highest population in Jhabua district followed by Dhar, Barwani and West Nimar districts. Gonds have major concentration in Chhindwara, Mandla, Betul, Seoni and Shahdol districts. Other four major groups Kol, Korku, Sahariya and Baiga have registered the highest population in Rewa, East Nimar, Shivpuri and Shahdol districts, respectively.
Sex Ratio
The over all sex ratio of the ST population in Madhya Pradesh is 975 females per 1,000 males which is lower than the national average of 978 for all STs. At the individual level, Gond and Baiga have over all sex ratio higher than that of the national average. Sahariya have shown the lowest overall sex ratio. The sex ratio among the STs, in the age group 0-6 years (979) is higher than that of all STs at the national level. Except Korku, Kol and Sahariya, the three major tribes have higher child sex ratio than that of the national average.
Sex Ratio
| Age group | All STs (India ) | All STs (MP) | Gond | Baiga | Bhil | Korku | Kol | Sahariya |
| All ages | 978 | 975 | 989 | 984 | 975 | 959 | 948 | 938 |
| 0 -6yrs. | 973 | 979 | 986 | 983 | 977 | 967 | 969 | 969 |
Literacy and Educational Level
The overall literacy rate of the STs has increased from 18.4 per cent at 1991 census to 41.2 per cent at 2001 census. Despite this increase, the literacy rate among the tribes of Madhya Pradesh is lower if compared with that of all STs at the national level (47.1 per cent). Male and female literacy rates among the tribes (53.5 per cent & 28.4 per cent) are also lower in comparison to those at the national level (59.2 per cent & 34.8 per cent).
Literacy Rate
| Literacy rate | All STs (state) | Gond | Korku | Kol | Bhil | Baiga | Sahariya |
| Persons | 41.2 | 50.3 | 38.8 | 35.9 | 34.5 | 32.3 | 28.7 |
| Females | 28.4 | 36.4 | 24.5 | 22.9 | 23.0 | 20.1 | 15.9 |
Only Gonds among major tribe have registered the higher overall literacy as well as female literacy if compared to those of the national average. Sahariya have returned the lowest overall literacy and female literacy both.
Among ST literates, 57.3 per cent are either without any educational level or have attained education below primary level. The proportion of literates who have attained education up to primary and middle levels constitute 24.8 per cent and 9.7 per cent respectively. Literates, who are educated up to matric/secondary/higher secondary, constitute 6.6 per cent only. Graduates and above are 1.4 per cent while non-technical and technical diploma holders constitute a negligible proportion.
Levels of Education among the major Scheduled Tribes
| Names of STs | Literate without educational level | Below primary | Educational levels attained | ||||
| Primary | Middle | Matric/Secondary Higher Secondary/ Intermediate | Technical &Nontechnical diploma | Graduate and above | |||
| All STs | 10.8 | 46.5 | 24.8 | 9.7 | 6.6 | 0.1 | 1.4 |
| Bhil | 15.5 | 47.1 | 21.2 | 8.2 | 6.3 | 0.1 | 1.6 |
| Gond | 8.4 | 45.0 | 27.4 | 10.9 | 7.0 | 0.1 | 1.2 |
| Kol | 7.2 | 47.1 | 26.9 | 11.4 | 6.6 | 0.0 | 0.6 |
| Korku | 10.1 | 56.0 | 22.9 | 6.8 | 3.6 | 0.0 | 0.5 |
| Sahariya | 15.4 | 62.2 | 16.1 | 4.0 | 1.8 | 0.1 | 0.5 |
| Baiga | 11.4 | 50.4 | 26.0 | 8.3 | 3.4 | 0.0 | 0.5 |
The data on the education levels attained by all STs show that the drop-out rate is high after primary level. It declines sharply from the middle level onwards. Similar trend has been shown by the major STs in attainment of education.
Out of total 35.1 lakh tribal children in the age group 5 -14 years, only 16.1 lakh have been attending school, constituting 46 per cent. As many as 18.9 lakh children in the corresponding age group have not been going to school. Among the major tribes, Gonds have more than 57.7 per cent of the total children in the corresponding age group attend school; these proportions are below 50 per cent among Kol, Korku and Baiga below 40 per cent among Bhil and Sahariya.
Percentage of school going children in the age group 5-14 yrs.
| Age Group | All STs | Bhil | Gond | Kol | Korku | Sahariya | Baiga |
| 5-14 yrs. | 46.0 | 36.3 | 57.7 | 49.4 | 43.3 | 34.7 | 42.7 |
Work Participation Rate (WPR)
The Work Participation Rate (WPR) of the ST population is 50.5 per cent, which is slightly higher than that of total STs at the national level (49.1 per cent). There has been a marginal decline of 1.3 per cent in the tribal working population during 1991-2001. Male and female work participation rates among the tribal communities are 53.2 per cent and 47.6 per cent respectively. Among the total workers, 67.8 per cent are main workers and this proportion is at par with the national average recorded for all STs (68.9 per cent).
Among the major tribes, Bhil, Gond, Korku and Baiga have higher WPR than that of the national average.
Category of Workers
‘Cultivators’ constitute the highest proportion (46.8 per cent) among the total workers, which is higher than that of all STs at the national level (44.7 per cent). ‘Agricultural Labourers’ account for 42.1 per cent, which is higher than the national average of 36.9 per cent recorded by all STs in this category. ‘Cultivators‘and ‘Agricultural Labourers’ together constitute 89 per cent of the total workers. ‘Other Workers’ constitute 10 per cent. This proportion is lower than that of the national average (16.3 per cent) whereas workers engaged in ‘Household Industry’ (HHI) constitute 1.1 per cent, which is almost half of the national average (2.1 per cent).
Percentage Distribution of Workers in four Economic Categories
| Economic category | All STs | Bhil | Gond | Kol | Korku | Sahariya | Baiga |
| Cultivators | 46.8 | 60.7 | 46.8 | 12.0 | 38.8 | 28.2 | 32.6 |
| Agricultural Labourers | 42.1 | 31.4 | 42.5 | 70.4 | 54.5 | 56.9 | 54.7 |
| HHI Workers | 1.1 | 0.3 | 1.4 | 1.0 | 1.5 | 0.9 | 1.8 |
| Other Workers | 10.0 | 7.6 | 9.3 | 16.6 | 5.2 | 14.0 | 10.9 |
Among the major tribes, Bhil have more than 60 per cent workers are ‘Cultivators’ whereas 70 per cent Kol workers are ‘Agricultural Labourers’. Sahariya, Baiga and Kol have more than 50 per cent of total workers are ‘Agricultural Labourers’. In the category of ‘Other Workers’, Kols hold the first position, followed by Sahariya, Baiga etc.
Marital Status
The data show that 51.9 per cent of the ST population is ‘never married’ whereas ‘married’ persons constitute 43.9 per cent. ‘Widowed’ persons form 3.9 per cent while less than half per cent are (0.4 per cent) ‘divorced and separated’.
Marriages of girls and boys below the legal age for each are in practice among the tribes of Madhya Pradesh. Married girls below 18 years and married boys below 21 years constitute 2.5 per cent and 4.6 per cent respectively. These proportions are higher than those recorded for all STs at the national level (2.1 per cent and 2.8 per cent). The STs namely, Kol, Sahariya and Baiga have registered the proportions of such marriages higher than the State average.
The mean number of children ever born per ever married ST woman (45 – 49 yrs.) is 5 which is higher than the total STs at national level (4).
Religion
Hinduism is the predominant religion (91.1 per cent) of the State. As many as 96.1 per cent STs are Hindus. Tribes following ‘other religions and persuasions’ account for 3.2 per cent. Christian and Muslim tribes constitute 0.5 per cent and 0.1 per cent respectively.
Source: Office of the Registrar General, India
Photo Gallery
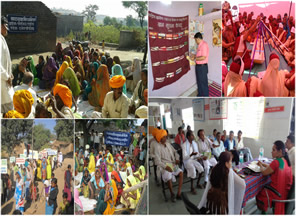
Latest Events
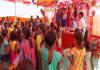 Second Sponsor Day Programme of the year 2017 was organised by Sampark Samaj Sevi Sanstha at Panchpipla village. This is one of the tribal populated village of the Jhabua...
More inLatest Events